#>
#> Call:
#> lm(formula = body_mass_g ~ flipper_length_mm)
#>
#> Residuals:
#>      Min       1Q   Median       3Q      Max
#> -1058.80  -259.27   -26.88   247.33  1288.69
#>
#> Coefficients:
#>                    Estimate Std. Error t value Pr(>|t|)
#> (Intercept)       -5780.831    305.815  -18.90   <2e-16 ***
#> flipper_length_mm    49.686      1.518   32.72   <2e-16 ***
#> ---
#> Signif. codes:  0 '***' 0.001 '**' 0.01 '*' 0.05 '.' 0.1 ' ' 1
#>
#> Residual standard error: 394.3 on 340 degrees of freedom
#>   (2 observations deleted due to missingness)
#> Multiple R-squared:  0.759,  Adjusted R-squared:  0.7583
#> F-statistic: 1071 on 1 and 340 DF, p-value: < 2.2e-16Interpreting Output
Learning Objectives
R
Python
Julia
SPSS
Stata
SAS
Excel
Minitab
Software
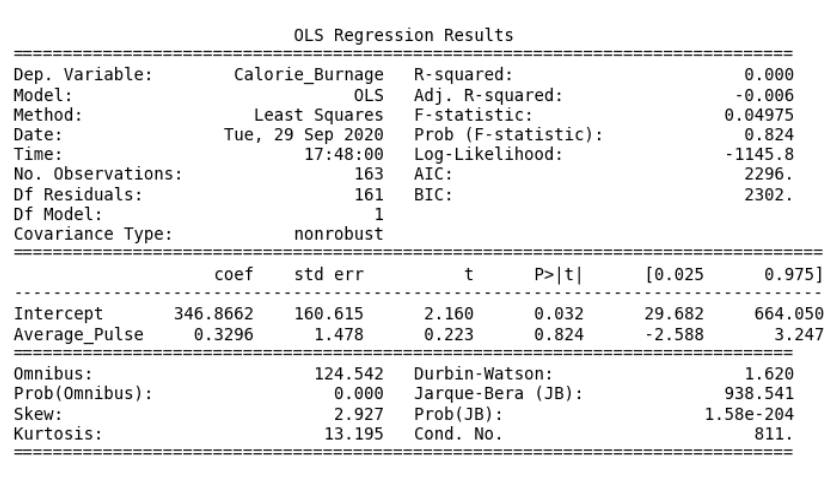
R

Python

Julia

SAS

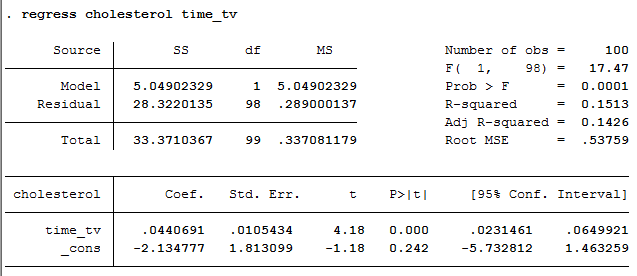
Stata

SPSS

Excel

Minitab

R
Output
Python
Output

Julia
Output

SAS
Output

Stata
Output

SPSS
Output

Excel
Output

Minitab
Output
